Transforme dados em estratégias de crescimento

Consultoria e soluções personalizadas para o seu sucesso.

Consultoria Especializada

Desenvolvemos estratégias para maximizar seu potencial empresarial.

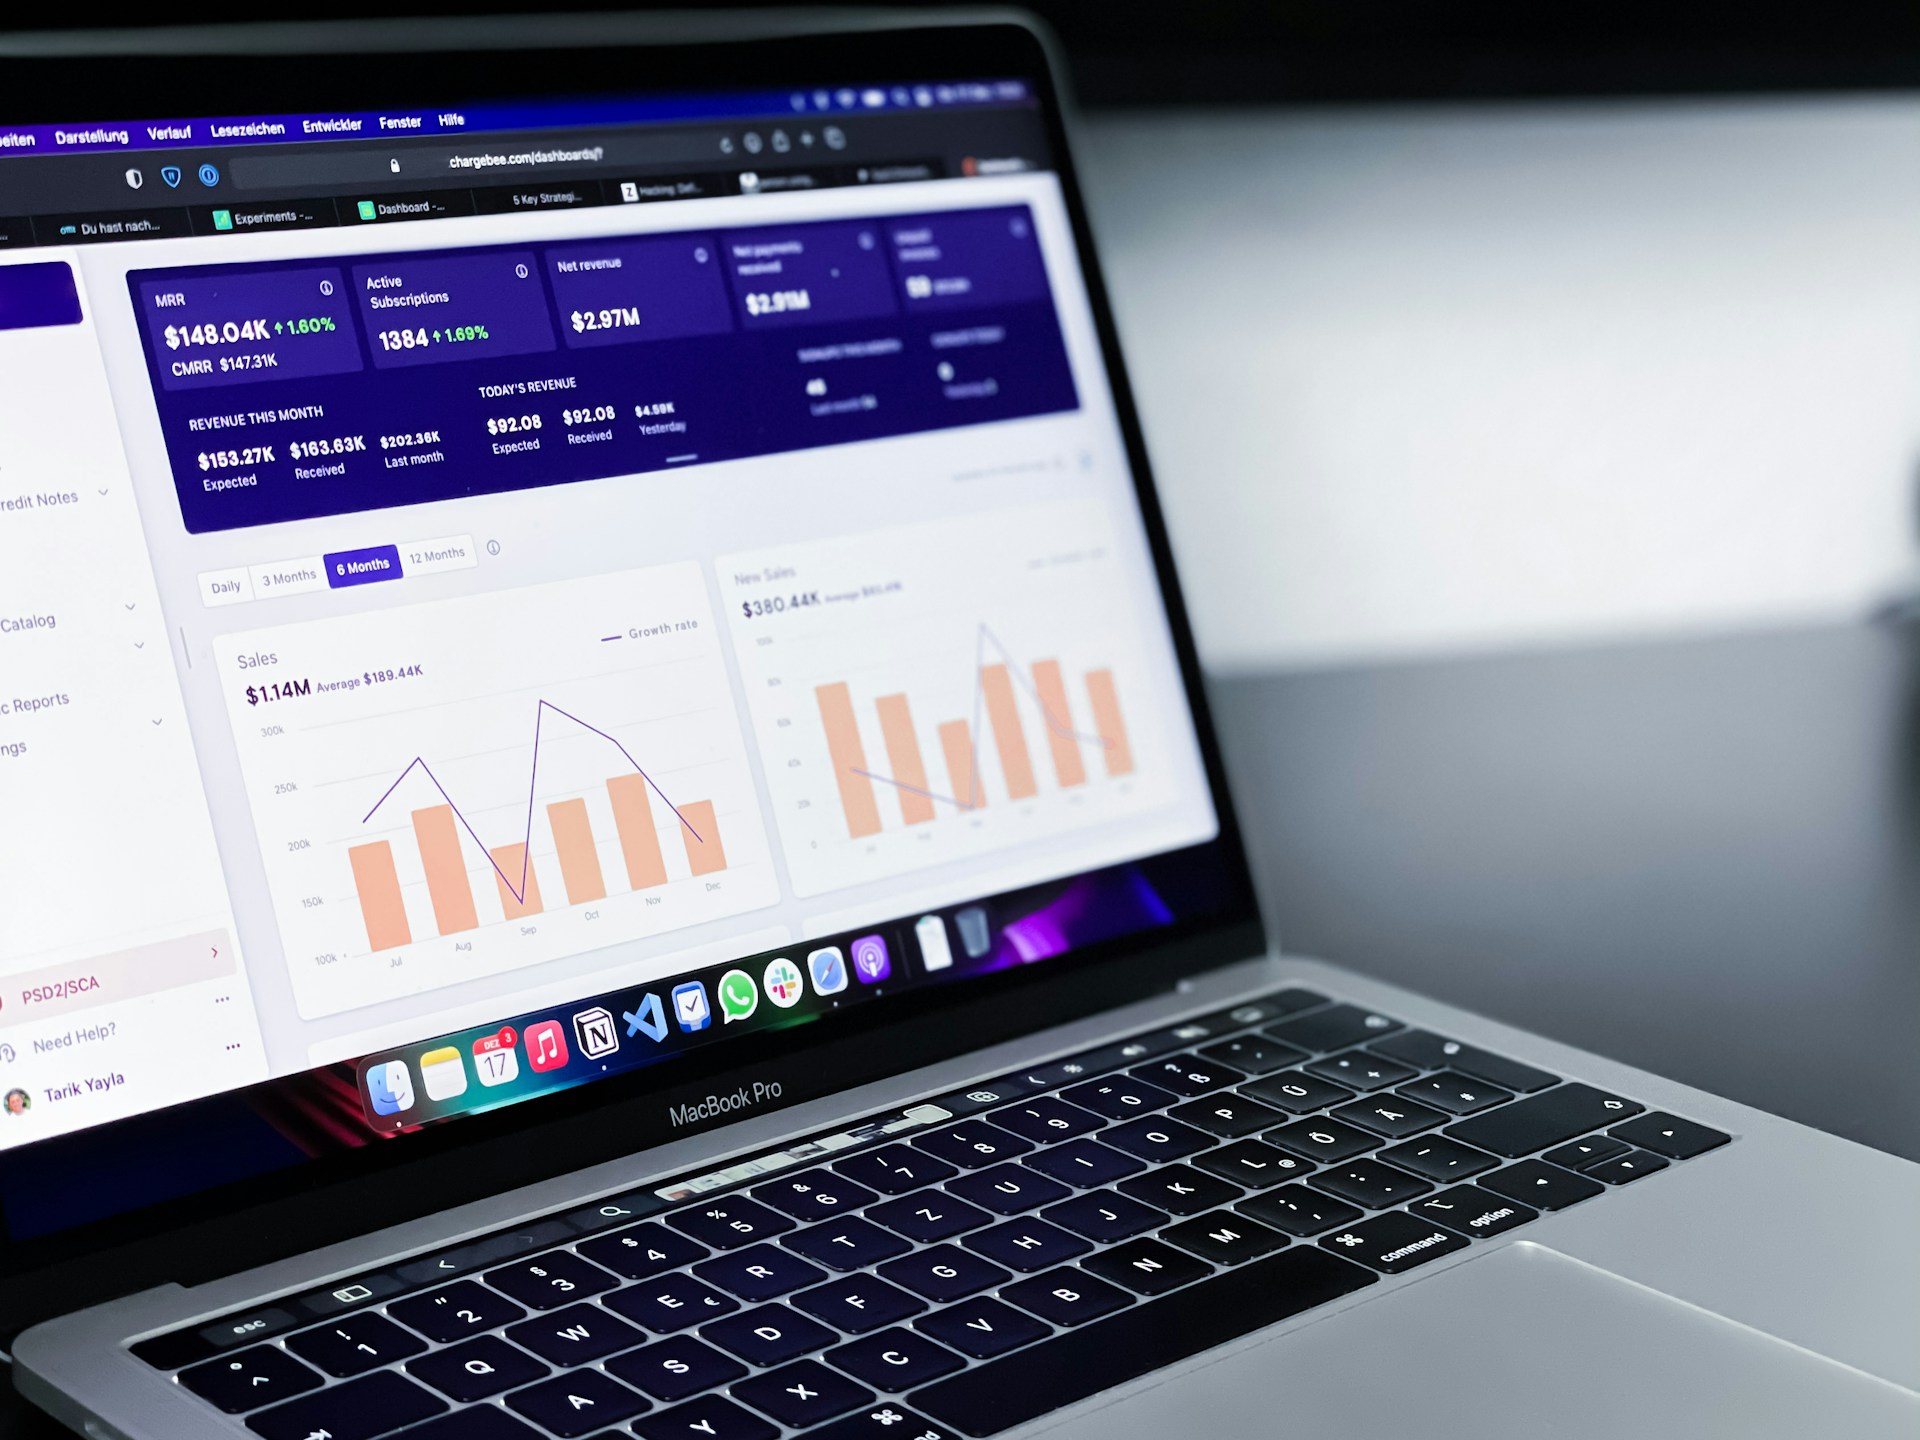
Dashboards personalizados para melhor visualização de dados.

Treinamentos Exclusivos

Soluções Empresariais
Análise de Dados

Transformando dados em estratégias

Na Revex Analytics, capacitamos empresas a dominar dados e tomar decisões estratégicas com clareza e excelência em consultoria e soluções personalizadas.

A computer screen displaying analytics dashboards with various charts, including a line graph on the left and a cohort analysis table on the right. The table is populated with different shades of blue, indicating varying levels of user activity over several weeks. Text labels and numbers detail user retention statistics.
An abstract, pastel-colored, 3D-rendered representation of data analysis and search engine optimization (SEO). The image features a computer interface with various analytics symbols, including a magnifying glass, bar charts, pie charts, and a search bar with the text 'SEO'. Surrounding the interface are different objects such as a potted plant, a cup with a saucer, and a megaphone, all placed on a light green background.
A graphic with text reading 'Exploring Opportunities for D2C Startups in the Post-COVID-19 World.' It features a target with an arrow, a computer monitor displaying an upward graph, a calendar, a rocket icon, and a clipboard with colorful sticky notes.

Quem somos nós

Oferecemos dashboards sob medida, treinamentos exclusivos e soluções empresariais, sempre com foco em resiliência, clareza e inovação para o futuro.

Serviços Personalizados Revex

Transformamos dados em estratégias de crescimento para empresas e profissionais com excelência e clareza.

Consultoria em Dados
A computer screen displaying a data analytics dashboard with graphs and charts. A blue line graph shows fluctuations in data over time, and a section highlights the number of page views. A pie chart is partially visible, indicating a breakdown of different data elements.

Capacitação para decisões estratégicas baseadas em dados e insights personalizados para sua empresa.

A digital dashboard displaying various analytics charts and graphs. There is a line graph showing user engagement over time on the left, a section with total revenue marked as $74K, and bar charts illustrating user statistics by region. The central section highlights users in the last 30 minutes, focusing on different countries such as the United States, Canada, India, Pakistan, and Brazil.
Two people are sitting at a wooden table, engaging in a discussion. A laptop is open, displaying a statistical dashboard with charts and a world map. Several smartphones and notepads are scattered on the table. The focus is on the person's hand gesturing in conversation, indicating active engagement.
Dashboards Sob Medida

Criamos dashboards personalizados que facilitam a visualização e análise de dados essenciais.

Treinamentos Exclusivos em Dados

Desenvolva habilidades para dominar dados e impulsionar o crescimento da sua empresa.
woman wearing yellow long-sleeved dress under white clouds and blue sky during daytime

A Revex Analytics transformou nossos dados em estratégias eficazes, elevando nosso negócio a um novo patamar.

João Silva

A person is holding a smartphone displaying an analytics or insights screen with various metrics and numbers. The individual is wearing a casual white shirt and a watch with a black band. The surrounding environment includes an indoor plant.

Os dashboards personalizados da Revex nos ajudaram a tomar decisões mais assertivas e estratégicas rapidamente.

Maria Costa

A smartphone displays analytics data with graphs showing views, downloads, and likes. It is resting vertically on a white dock next to a small potted succulent plant. In the background, a large computer monitor is partially visible, along with a closed laptop and a white wireless earbud case.
★★★★★
★★★★★

Entre em Contato

Estamos prontos para ajudar sua empresa a transformar dados em estratégias de crescimento. Fale conosco e descubra como podemos colaborar.

Contato

55992101487

Suporte

rodrigotv@revexanalytics.com